Plotting
When Plots is loaded, the CTModelsPlots extension adds a recipe so a Solution can be drawn directly with plot / plot!. The recipe lays out the state, control, costate (and, when present, path constraints and their duals) on a shared time axis.
using CTModels
using Plots      # activates the CTModelsPlots extension

pre = CTModels.PreModel()
CTModels.variable!(pre, 0)
CTModels.time!(pre; t0=0.0, tf=1.0)
CTModels.state!(pre, 2)
CTModels.control!(pre, 1)
CTModels.dynamics!(pre, (r, t, x, u, v) -> (r[1] = x[2]; r[2] = u; nothing))
CTModels.objective!(pre, :min; lagrange=(t, x, u, v) -> u^2)
CTModels.time_dependence!(pre; autonomous=true)
ocp = CTModels.build(pre)

N = 101
T = collect(range(0.0, 1.0; length=N))
sol = CTModels.build_solution(ocp, T, hcat(cos.(T), -sin.(T)),
    reshape(-cos.(T), N, 1), Float64[], zeros(N, 2);
    objective=0.5, iterations=10, constraints_violation=1e-9,
    message="ok", status=:optimal, successful=true)
Default plot
Plots.plot(sol)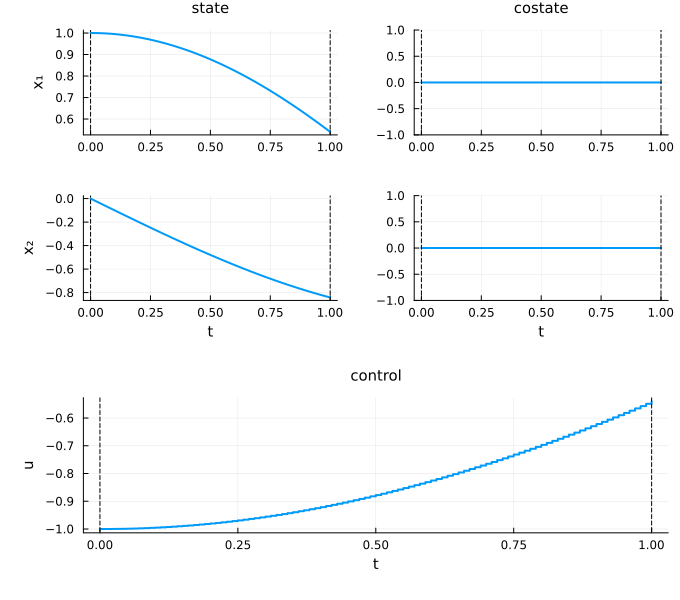
Choosing what to draw
Positional symbols after the solution select the groups to draw, among :state, :costate, :control, :path (path constraints) and :dual (their multipliers). Without any, a default set is chosen from the problem:
Plots.plot(sol, :state, :control)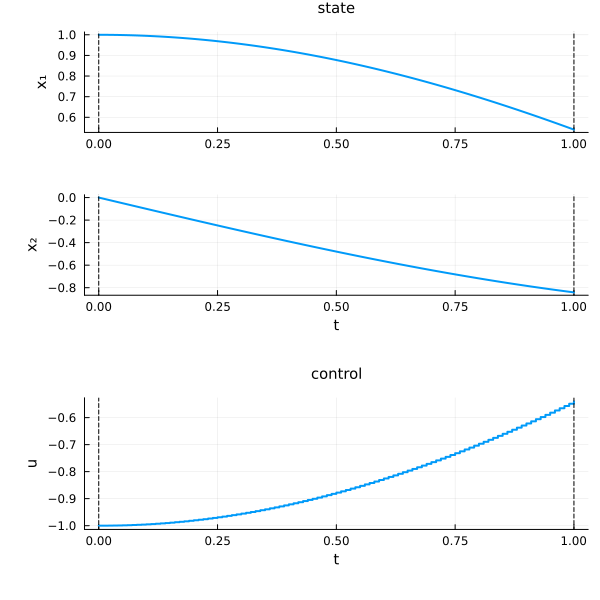
Layout and control options
| Keyword | Values (default first) | Effect |
|---|---|---|
layout | :split / :group | one subplot per component, or one subplot per group with a legend |
control | :components / :norm / :all | a curve per control component, the norm |
time | :default / :normalize | physical time, or rescaled to |
color, size | colour of every curve, figure size |
Plots.plot(sol; layout=:group, control=:all)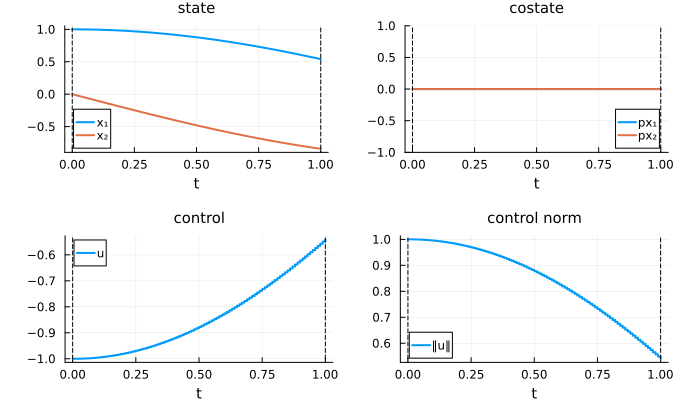
Each group and decoration also takes a style keyword, a NamedTuple of plotting attributes or :none to hide it: state_style, costate_style, control_style, path_style, dual_style, time_style (initial and final time markers), and the bound decorations state_bounds_style, control_bounds_style, path_bounds_style.
Plots.plot(sol; state_style=(color=:blue,), costate_style=:none)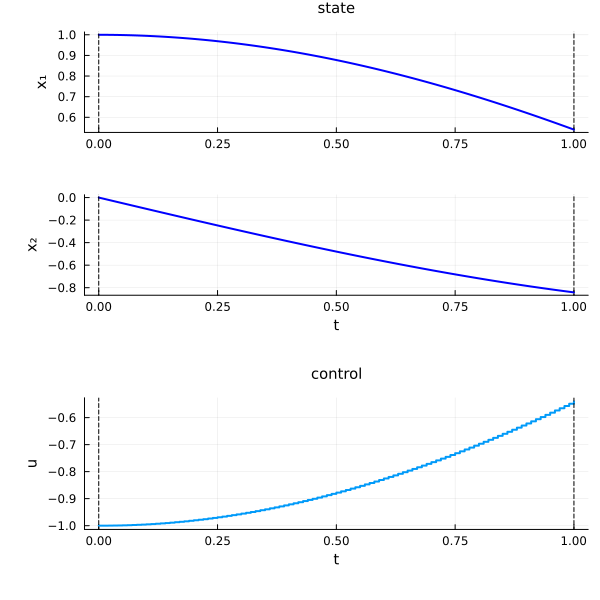
Switching times and phase labels
A solution with a switching structure (see Switching structure) draws each jump as a vertical segment, marks each switching time with a vertical line (switching_style, by default like the time markers; :none hides them) and writes the phase labels on the control cell (phase_labels = :control, :all or :none; phase_labels_style for their style). With jumps = :none, the curve is broken between the two limits instead of drawing the vertical segment.
Overlaying solutions
plot! adds a solution to an existing figure — handy for comparing two solves on the same axes:
plt = Plots.plot(sol)
Plots.plot!(plt, sol; time=:normalize)
plt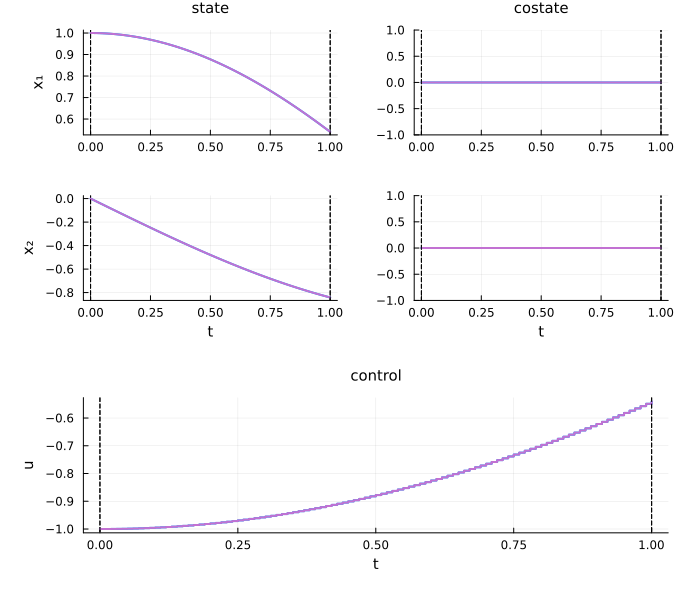
Because the recipe reads the typed solution (its time grids, interpolation kind, and dual structure) rather than raw arrays, the same call works for unified- and multiple-grid solutions alike — see Time grids.
Makie backend
A second backend renders the same figure with Makie.jl, at feature parity with the Plots backend (reference lines, step controls, overlay and forwarded attributes all supported). Load a Makie backend package (CairoMakie, GLMakie, …); the CTModelsMakie extension then provides Makie.plot(sol), returning a Makie.Figure:
Makie.plot(sol)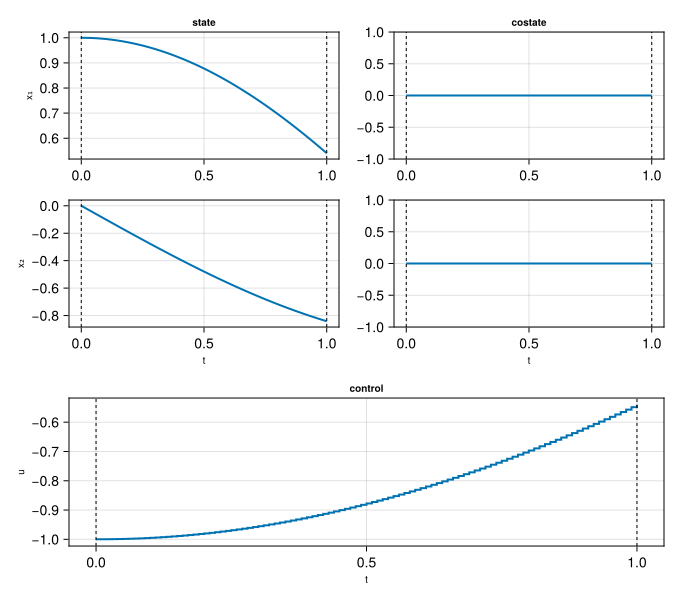
Makie.plot(sol; layout=:group, control=:all)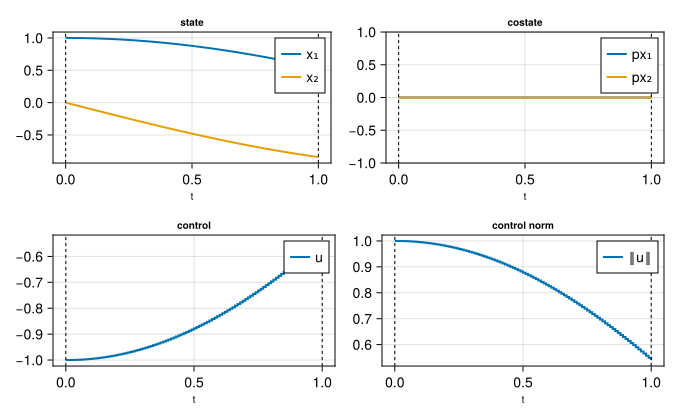
Makie.plot! overlays onto an existing figure, the same way Plots.plot! does:
f = Makie.plot(sol)
Makie.plot!(f, sol; time=:normalize)
f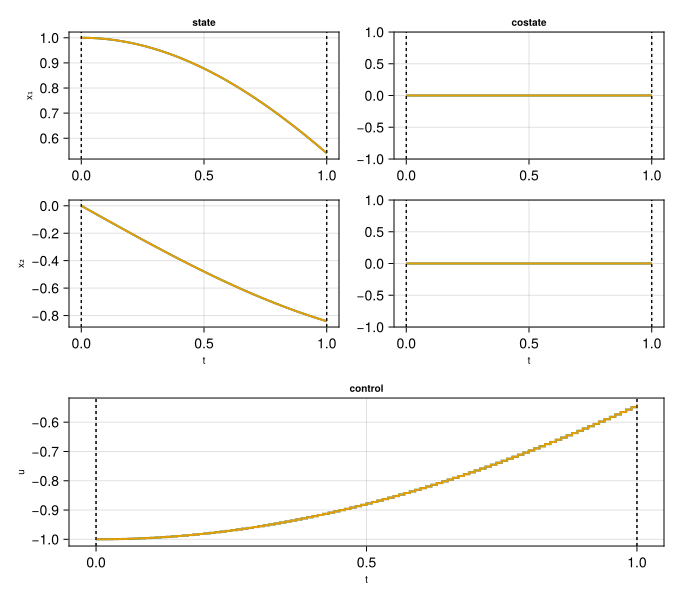
The positional group symbols and the keyword arguments (layout, control, time, the *_style keywords, color, size) are identical to the Plots backend. When both Plots and a Makie package are loaded, plot must be qualified — Plots.plot(sol) renders with Plots, Makie.plot(sol) with Makie.
Style keywords beyond the neutral vocabulary (color, linewidth, linestyle, alpha, seriestype) are resolved per backend: the Plots backend forwards any attribute Plots recognises, while the Makie backend only forwards a fixed whitelist and drops the rest. See the Plotting Engine guide in the CTBase documentation ("User Attributes: Series vs Axis") for the exact rule.