Plotting Engine
The CTBase.Plotting submodule is a generic, domain-free plotting engine. It manipulates a backend-agnostic intermediate representation (IR): a weighted tree of titled axes carrying series and decorations. The engine knows nothing about states, controls, costates, or optimal control — case layers (CTModels, CTFlows) build the IR and hand it to a backend via CTBase.Plotting.render.
Architecture Overview
Case layer (CTModels, CTFlows, …)
    │
    │  builds
    ▼
Panel  ──lower──►  IR (Series, Axes, Leaf/HBox/VBox, Figure)
    │                           │
    │                           │  render / render!
    ▼                           ▼
Combinators                   Backend
(Stacked / Paired / Grid)     ├─ Plots.jl  →  CTBasePlots extension
                              └─ Makie.jl  →  CTBaseMakie extension
All IR types and transforms live in src (no backend dependency). Only the drawing lives in weak-dependency extensions — CTBasePlots for Plots.jl and CTBaseMakie for Makie.jl — each loaded automatically when its backend package (Plots, or CairoMakie / GLMakie) is available.
Intermediate Representation
Series and Decorations
A CTBase.Plotting.Series is one plotted curve: (x, y) points with an optional label and a neutral style vocabulary (color, linewidth, linestyle, alpha, seriestype, z_order). A backend_kwargs NamedTuple provides an escape hatch for backend-specific attributes.
using CTBase

s = CTBase.Plotting.Series(
    [0.0, 1.0, 2.0],
    [0.0, 1.0, 0.0];
    label="x(t)",
    style=(color=:blue, linewidth=2),
)
Series "x(t)" (3 points)
style: (color = :blue, linewidth = 2)CTBase.Plotting.HLine and CTBase.Plotting.VLine are reference lines drawn on top of series (e.g. box bounds, initial/final time markers).
Axes
An CTBase.Plotting.Axes is a single drawable cell: one axis system holding a list of Series, optional decorations, labels, and y-limit settings.
ax = CTBase.Plotting.Axes(
    [s];
    title="State",
    xlabel="t",
    ylabel="x",
)
Axes "State" (1 series)
├─ Series "x(t)" (3 points)
│ style: (color = :blue, linewidth = 2)
└─ xlabel: t, ylabel: xThe ylims field supports:
nothing— backend default(lo, hi)— fixed limits:auto— backend auto-scaling:auto_guarded— auto, but widen near-constant series so the axis does not collapse
Layout Tree
The layout is a weighted tree with three node types:
| Node | Role |
|---|---|
CTBase.Plotting.Leaf | A single cell wrapping one Axes |
CTBase.Plotting.HBox | Columns side by side (weights = relative widths) |
CTBase.Plotting.VBox | Rows stacked vertically (weights = relative heights) |
leaf1 = CTBase.Plotting.Leaf(ax)
leaf2 = CTBase.Plotting.Leaf(CTBase.Plotting.Axes(
    [CTBase.Plotting.Series([0.0, 1.0], [1.0, 0.0]; label="u(t)")];
    title="Control", xlabel="t", ylabel="u",
))

# Stack state above control
tree = CTBase.Plotting.VBox([leaf1, leaf2])
VBox (2 children)
├─ Leaf
│ └─ Axes "State" (1 series)
│ ├─ Series "x(t)" (3 points)
│ │ style: (color = :blue, linewidth = 2)
│ └─ xlabel: t, ylabel: x
└─ Leaf
└─ Axes "Control" (1 series)
├─ Series "u(t)" (2 points)
└─ xlabel: t, ylabel: uFigure
A CTBase.Plotting.Figure bundles a layout root with optional overall size and title. When size === nothing, the engine computes a default from the tree shape.
fig = CTBase.Plotting.Figure(tree; title="Solution")Figure "Solution"
└─ VBox (2 children)
├─ Leaf
│ └─ Axes "State" (1 series)
│ ├─ Series "x(t)" (3 points)
│ │ style: (color = :blue, linewidth = 2)
│ └─ xlabel: t, ylabel: x
└─ Leaf
└─ Axes "Control" (1 series)
├─ Series "u(t)" (2 points)
└─ xlabel: t, ylabel: uCase-Layer Building Blocks
Panel
A CTBase.Plotting.Panel is the case layer's convenient input unit: a titled group of components sharing one time grid. It is not part of the rendered IR — the CTBase.Plotting.lower step turns it into Leaf/Axes nodes.
t = collect(0.0:0.1:1.0)
data = hcat(sin.(t), cos.(t))  # (n_times, 2)

panel = CTBase.Plotting.Panel(
    t, data;
    title="State",
    labels=["x₁", "x₂"],
)
Panel "State" (2 components, 11 points)
├─ x₁
└─ x₂Lowering
CTBase.Plotting.lower turns a Panel into a layout node. Two layouts are available:
:split(default) — one cell per component (ylabel = component name, xlabel on the bottom cell only, title on the top cell only, no legend).:group— one cell with all components overlaid and a legend.
node = CTBase.Plotting.lower(panel; layout=:split)VBox (2 children)
├─ Leaf
│ └─ Axes "State" (1 series)
│ ├─ Series "" (11 points)
│ └─ ylabel: x₁
└─ Leaf
└─ Axes "" (1 series)
├─ Series "" (11 points)
└─ xlabel: t, ylabel: x₂Optional keyword arguments:
time::default(real time) or:normalize/:normalise(rescale to[0, 1]).time_name: x-axis label for the bottom cell.vlines: vertical reference lines attached to every cell.hlines: per-component horizontal reference lines.
Combinators
Level-2 declarative layout builders operate on already-lowered nodes:
| Combinator | Layout |
|---|---|
CTBase.Plotting.Stacked | Vertical stack (VBox) with auto row weights |
CTBase.Plotting.Paired | Side-by-side (HBox) with auto column weights |
CTBase.Plotting.Grid | Rectangular grid of nodes |
With weights=:auto (default), each child's weight is its extent along the combinator's axis — so cells stay uniform in size even when children have different numbers of rows or columns.
state_node = CTBase.Plotting.lower(panel; layout=:split)
control_panel = CTBase.Plotting.Panel(
    t, reshape(t, :, 1);
    title="Control", labels=["u"],
)
control_node = CTBase.Plotting.lower(control_panel; layout=:split)

# Stack state above control
full = CTBase.Plotting.Stacked([state_node, control_node])
VBox (2 children)
├─ VBox (2 children)
│ ├─ Leaf
│ │ └─ Axes "State" (1 series)
│ │ ├─ Series "" (11 points)
│ │ └─ ylabel: x₁
│ └─ Leaf
│ └─ Axes "" (1 series)
│ ├─ Series "" (11 points)
│ └─ xlabel: t, ylabel: x₂
└─ Leaf
└─ Axes "Control" (1 series)
├─ Series "" (11 points)
└─ xlabel: t, ylabel: uBackend Contract
CTBase.Plotting.AbstractPlottingBackend is the supertype for rendering backends. CTBase.Plotting.PlotsBackend is the concrete Plots.jl backend — its render/render! methods live in the CTBasePlots extension.
CTBase.Plotting.MakieBackend is the Makie.jl backend, at feature parity with the Plots backend; its render / render! methods live in the CTBaseMakie extension, loaded automatically when Makie is available (for example via CairoMakie or GLMakie).
CTBase.Plotting.render turns a Figure into a backend figure. CTBase.Plotting.render! overlays a Figure onto an existing backend target, targeting cells by the deterministic leaf order (see CTBase.Plotting.leaves).
Without a backend loaded, the fallback throws an CTBase.Exceptions.ExtensionError. This cannot be demonstrated in these docs because make.jl loads both Plots and CairoMakie to produce the examples below, so the CTBasePlots and CTBaseMakie extensions are both active.
Once Plots is loaded, render(fig) produces a Plots.jl plot:
CTBase.Plotting.render(fig)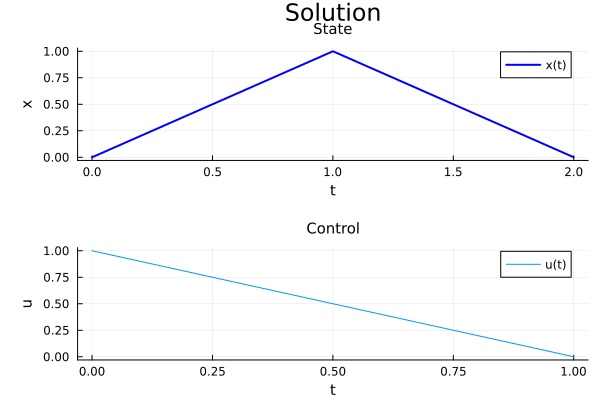
The same fig rendered through the Makie backend:
using CairoMakie: CairoMakie
CTBase.Plotting.render(CTBase.Plotting.MakieBackend(), fig)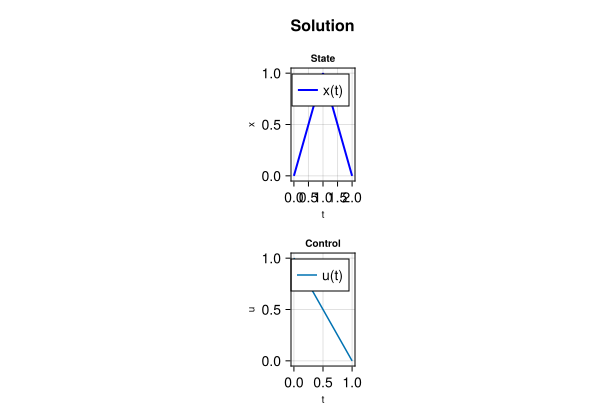
User Attributes: Series vs Axis
render(fig; kwargs...) and render! accept extra keyword arguments and split them into series attributes — forwarded to every curve — and axis attributes — applied to every cell. legend and ylims are special-cased: a user value overrides the IR default. The two backends make that split differently.
The Plots backend (CTBasePlots._partition_user) asks Plots itself: Plots.attributes(:Series) is the authoritative set of series-attribute names, so any kwarg in it goes to the series and everything else to the subplot. A key Plots does not recognise still reaches Plots, which emits its own warning. Layout keys the renderer owns (CTBasePlots._RESERVED_AXES_KEYS: subplot, title, xlabel, ylabel, legend, ylims, titlefont, guidefontsize) are dropped so the computed layout survives.
The Makie backend (CTBaseMakie._partition_user) has nothing to introspect — Makie exposes no attributes(:Series) analogue — so it carries curated whitelists: CTBaseMakie._SERIES_USER_KEYS (color, linewidth, linestyle, alpha, marker, markersize, label) for series, CTBaseMakie._AXIS_USER_KEYS (a fixed list of Makie.Axis constructor keys) plus legend / ylims for cells, with CTBaseMakie._RESERVED_AXES_KEYS protected. A kwarg in neither whitelist is silently dropped — a bare Makie.Axis throws on an unknown keyword, so unknown keys cannot be forwarded the way Plots tolerates.
For a case layer or a caller this means:
The portable surface is the neutral style vocabulary (
color,linewidth,linestyle,alpha,seriestype,z_order) pluslegendandylims— these behave identically on both backends.A genuinely backend-specific option belongs in a
CTBase.Plotting.Seriesstyle'sbackend_kwargsescape hatch, not in arenderkwarg: only the matching backend honours it, and the Makie whitelist would drop it from arendercall anyway.
Leaf Traversal
CTBase.Plotting.leaves returns the Leaf nodes of a layout tree in deterministic depth-first order. This order is the contract for targeting existing cells by index when overlaying with render!.
Function Reference
See Also
Exceptions guide —
ExtensionErrorwhen no backend is loaded.Traits guide — the trait-parameter pattern used by
Interpolant.